
CHARLESTON, W.Va. — Important information moves swiftly and steadily during health emergencies. It can be challenging for reporters to communicate the latest data and information effectively and harder still for news consumers to keep up with the daily barrage of facts and figures being thrown their way.
Many media organizations, including some on the local level, rely on maps to quickly communicate essential health data and other related details during such emergencies.
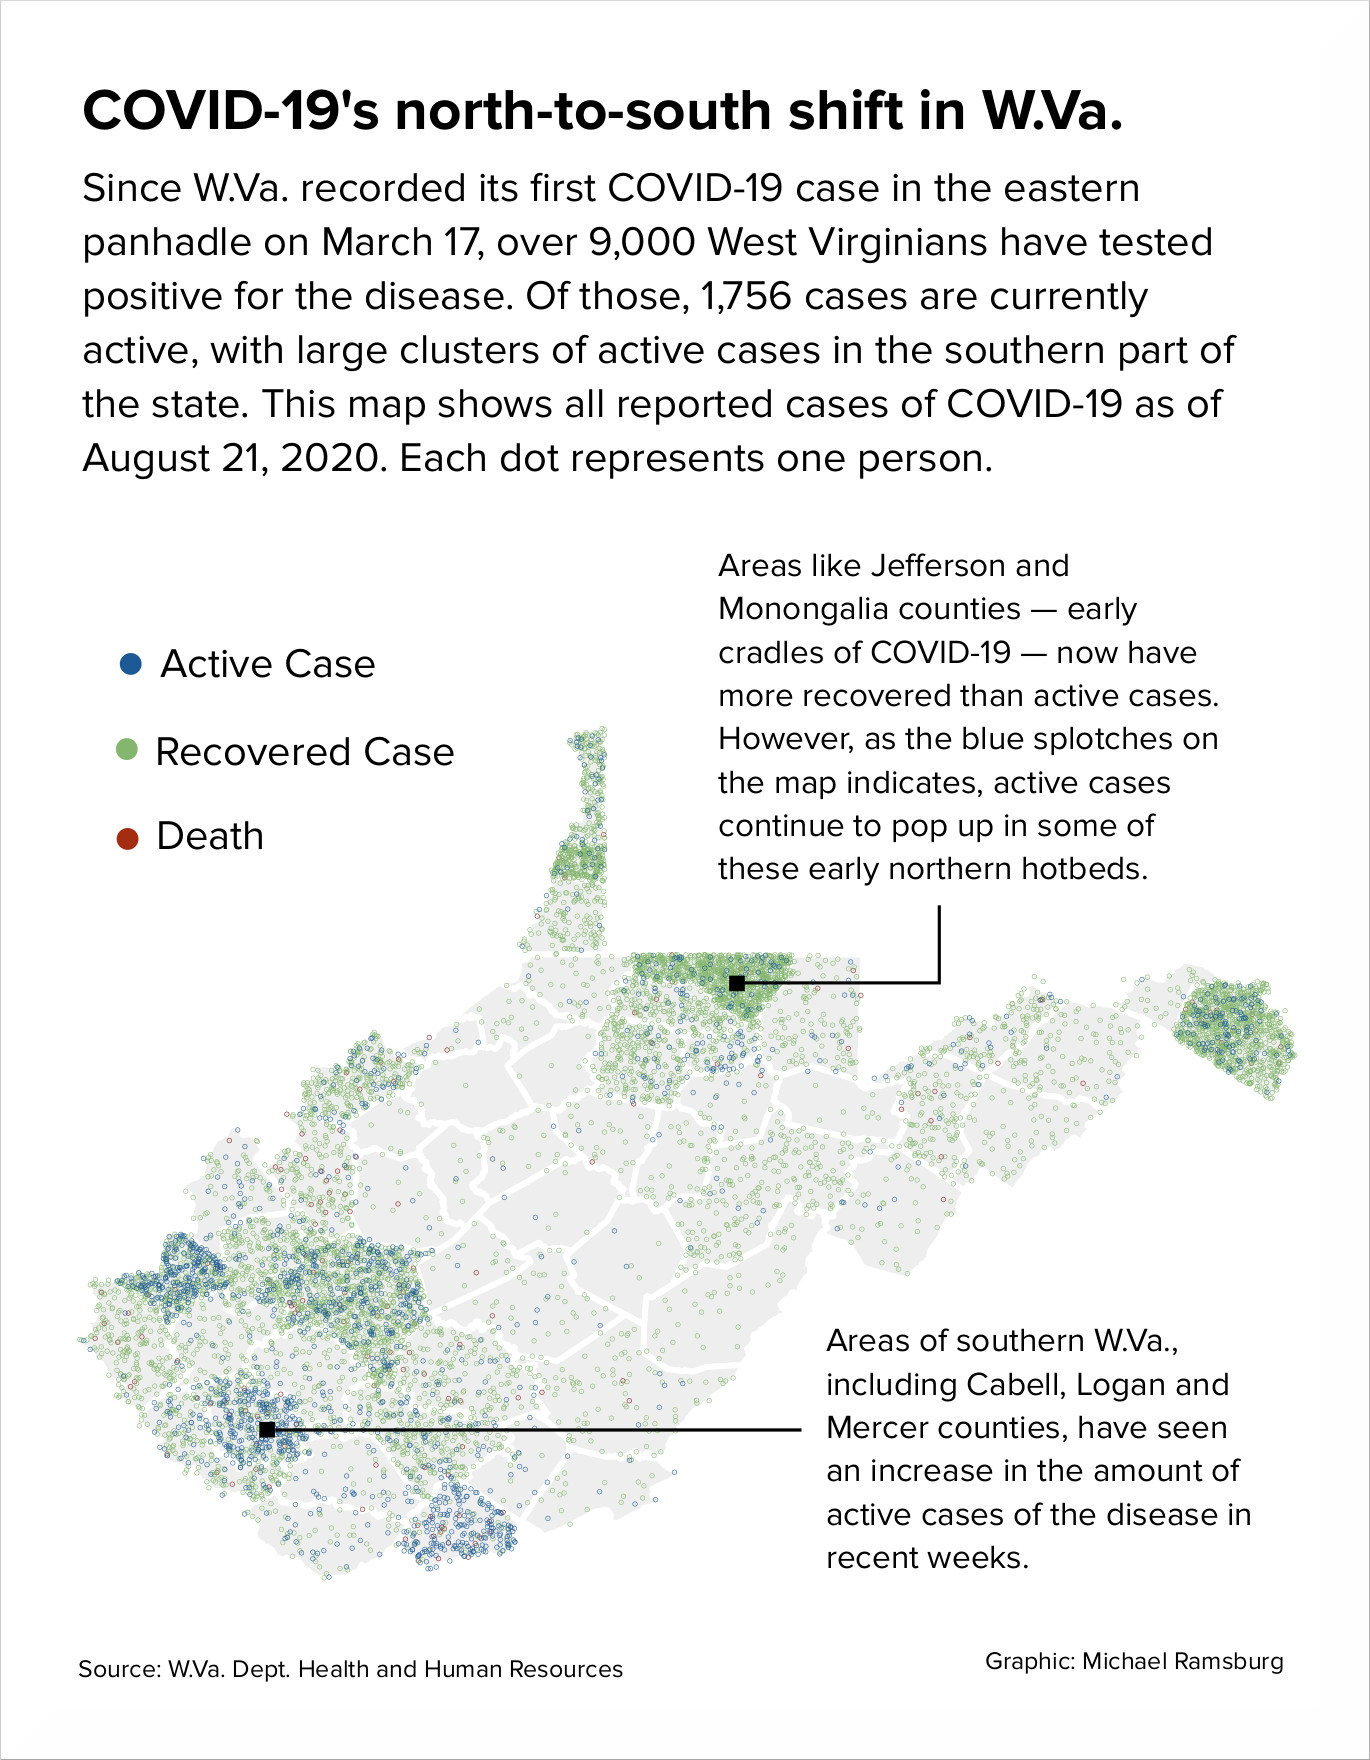
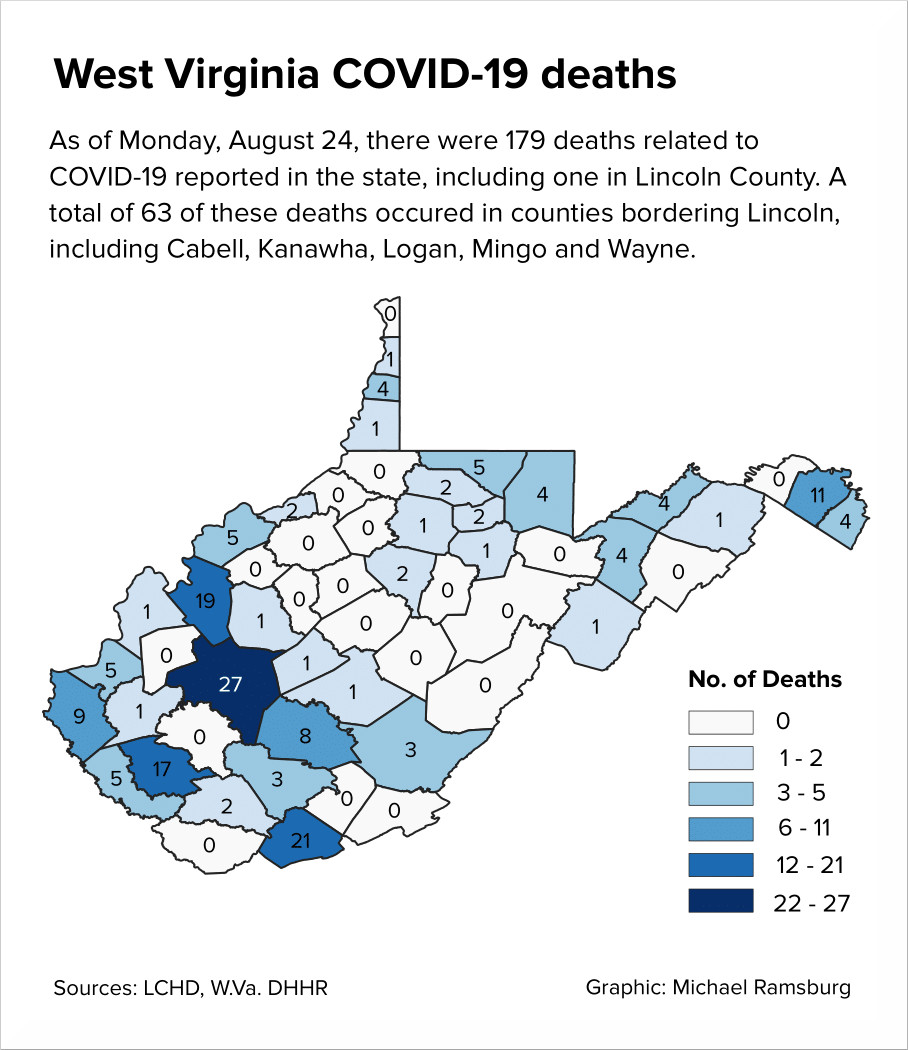
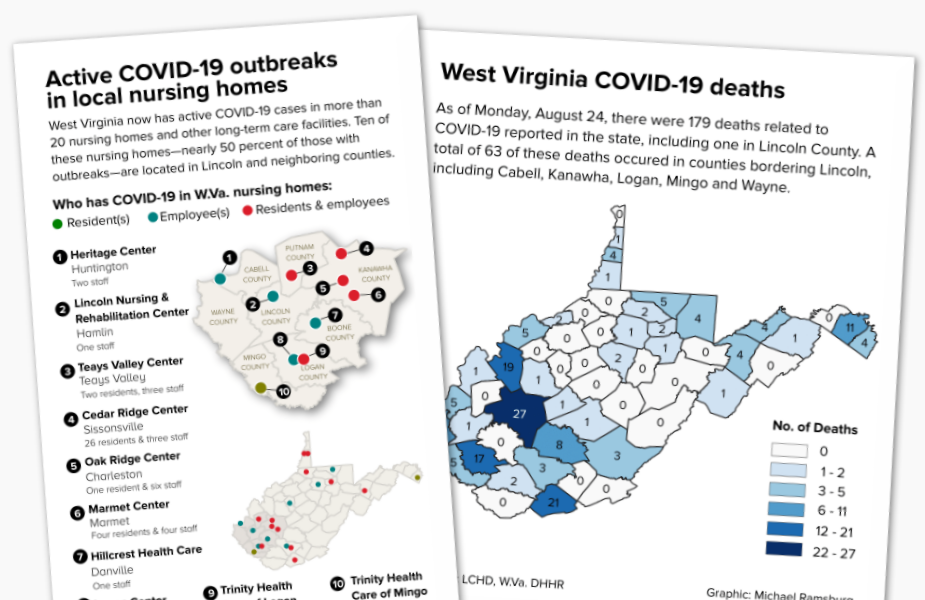
I created the following maps during my time at The Lincoln Journal. They were designed to help the paper's readers and social media visitors understand overall trends in local and statewide Covid-19 data.
While existing coronavirus data was plentiful on the state and national levels, local-level statistics were harder to come by. With sourcing from the county health department and other local healthcare providers, we could bridge information gaps, providing valuable information in a visual capacity to area citizens.
.jpeg)